The first mention of hemostasis monitoring appeared over 3000 years ago with the description of the first bleeding time test after skin injury performed by the Chinese Emperor Huang Ti. Bleeding time was also described by Sydenham in the early 17th century, but it was not until the 1900s that coagulation disorders began to be assessed by this bedside test. Further developments in the understanding of the cascade mechanism of blood coagulation and the interaction of various coagulation factors led to the development of the first tests for assessing blood coagulation [1, 2, 3]. Initially, these methods were based on visual assessment of clot formation or changes in sample viscosity (4). With progressive development, visual clot detection methods were replaced by optical clot detection technology using turbidimetric [1] and nephelometric techniques [5], in which changes in the optical density of the sample reflected the formation of a fibrin network. In recent years, hemostasis analyzers have emerged that use other methods of detecting sample clot formation, such as electrochemical and high-frequency piezography.

The need for point-of-care (POC) hemostasis testing technologies has become essential because centralized laboratories have become increasingly unable to provide results in the timeframes necessary to rapidly change anticoagulant therapy [6]. This is equally true for patients requiring therapy adjustments during intensive care. A review by CF Weber et al [7] demonstrated the impact of POC hemostasis testing on the frequency and volume of perioperative blood transfusions. In addition, the following are important reasons for the use of POC hemostasis testing methods:
- the need for an emergency assessment of the state of hemostasis in conditions of limited availability of a centralized clinical diagnostic laboratory (for example, in the 24-hour operation of intensive care units, emergency rooms, and field medicine);
- the need for dose selection and adjustment of anticoagulant therapy with vitamin K antagonists at home and in the field;
- the need for an urgent assessment of the level of “artificial” hypocoagulation during operations on the heart and large vessels and the selection of the dose of heparin inhibitors.
A fairly large variety of modern ROS hemostasis analyzers can be divided into several groups.
ROS analyzers for integrated assessment of hemostasis
- classical thromboelastography
- modified thromboelastography
- piezoelectric analyzers
Specialized ROS hemostasis analyzers
- platelet function analyzers
- blood heparin analyzers
- PT/INR analyzers, used primarily for selecting and adjusting the dose of warfarin
- analyzers of traditional blood coagulation tests (PT, APTT, thrombin time, fibrinogen).
ROS analyzers for integrated assessment of hemostasis
CLASSICAL THROMBOELASTOGRAPHY
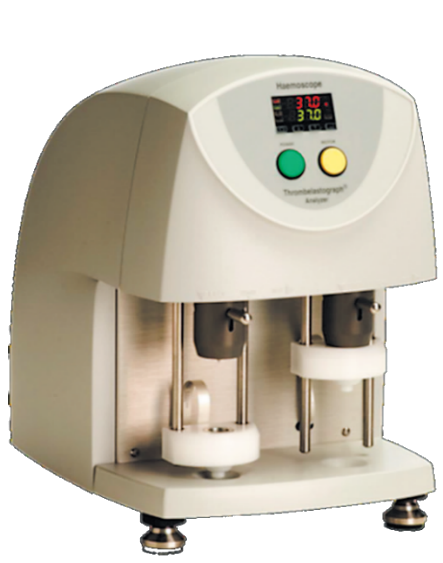
The thromboelastograph (TEG), invented in 1948 (Hartert), is the first analyzer for assessing the viscoelastic properties of a blood clot, which allows one to evaluate the clotting time of a blood sample, the rate of clot formation, the maximum clot density, fibrinolytic activity, the presence of heparin or new oral anticoagulants, to assess the functional activity of platelets, and to evaluate the quality of fibrinogen.
A small amount of sample (whole blood, citrated whole blood) (360 µl) is placed in a plastic measuring cuvette, into which a plastic pin is inserted. The cuvette is set in oscillation at an angle of 4°45 min (Fig. 1).

Once the sample begins to clot and fibrin threads appear, the cuvette’s movement is transmitted to the pin and recorded by an optical measuring system. The change in clot density is graphically displayed as a thromboelastogram.
The study has gained worldwide popularity for monitoring the hemostasis system in liver transplantation, cardiovascular surgery, obstetrics, and resuscitation [8, 9, 10].
The devices that use the above-described method include the TEG 5000 analyzers (Haemonetics, USA) (Fig. 2), which are well known on the world and Russian markets, the automated 4-channel analyzer Multi TEMA (Hemologix, Italy) (Fig. 3) and its single-channel modification Mono TEMA-A . (Fig. 4).
Both devices are registered in the Russian Federation.
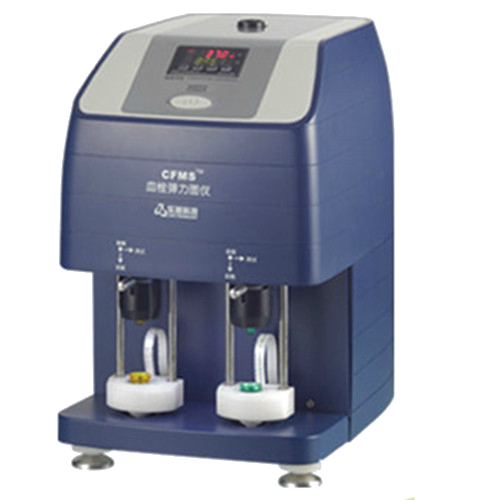
In recent years, new thromboelastographs using the classical TEG method, manufactured in China, have appeared on the market: CFSM (Lepu Medical) (Fig. 5) and Haema T4 Futures (Medcaptain) (Fig. 6).
None of these devices are registered on the Russian market.
ROTATIONAL THROMBOELASTOMETRY
This method also evaluates the viscoelastic properties of blood, but unlike the Hartert method, 360 µl of sample is placed in a stationary, heated cuvette, into which a disposable pin, attached to the tip of a rotating shaft, is lowered. The increase in clot density during sample clotting affects the shaft rotation, which is recorded by a sensor and displayed graphically as a thromboelastogram (Fig. 7).

This method is implemented in the 4-channel ROTEM device (IL, USA) (Fig. 8), the latest modification of this device – ROTEM Delta is a combination of a 4-channel thromboelastograph and a 2-channel impedance aggregometer Rotem platelet, which allows studying platelet aggregation in whole blood.

The same company is currently presenting the automated single-channel Rotem sigma device (Fig. 9), which is of interest for use in express laboratories in intensive care units.

The key thromboelastogram parameters obtained by both methods are very similar and allow for the assessment of primarily the chronometric blood coagulation index, which corresponds to the time from the start of the study to the appearance of the first fibrin strands, the R value (TEG 5000), and the CT value (ROTEM). These parameters correlate most closely with traditional coagulation tests: clotting time, prothrombin time, and activated partial thromboplastin time (APTT). The rate of clot formation (fibrin polymerization) is reflected by the alpha angle and the K value (TEG 5000) (Fig. 10).

The most interesting parameter in TEG studies is the maximum clot density (MCF) (TEG5000), or MCF (ROTEM). This parameter comprehensively reflects clot properties, determined by the platelet count, the quality of their functional properties, the amount of fibrinogen, and the quality of the fibrin formed. Therefore, dynamic monitoring of this parameter is essential for understanding both the cause of postoperative bleeding and the appropriateness of therapy. A crucial characteristic of the thromboelastogram is its ability to assess fibrinolytic activity.
Monitoring the change in the value of the maximum clot density indicator for 20 and 30 minutes after reaching its maximum allows us not only to see the fibrinolysis process, but also to assess its speed.
ROS ANALYZERS OF VISCOELASTIC PROPERTIES OF BLOOD USING PIEZOEFFECT
The new Quantra™ Hemostasis Analyzer (Quantra) (HemoSonics LLC, Charlottesville, VA) was developed to automatically and rapidly test the viscoelastic properties of a blood clot at the patient’s bedside (Fig. 11).

Quantra’s operation is based on the patented SEER (Sonic Estimation of Elasticity via Resonance) Sonorheometry method, an original technology that uses ultrasound vibrations to measure the viscoelastic properties of a blood sample (Fig. 12). Fig. 12 Quantra’s operating principle
Quantra is an automated instrument that controls all aspects of testing, including temperature control, sample transfer, ultrasound emission, signal conversion and results printing.
The Quantra Surgical Cartridge is designed to assess the viscoelastic properties of a clot and diagnose the underlying causes of these changes. A 4-channel cartridge is used with the device. The first channel of the cartridge is optimized for measuring clotting time (Clot Time), while the second contains heparinase and determines Heparinase Clot Time, allowing for the calculation of Clot Time Ratio and assessment of the heparin level in the sample. Channel 3 is optimized for determining clot stiffness, determined by platelets and fibrinogen. Channel 4 determines the contribution of fibrinogen (Fibrinogen Contribution) to clot stiffness. In both channels, heparin is neutralized by hexadimethrine. The difference in Clot Stiffness and Fibrinogen Contribution values corresponds to the contribution of platelets to clot stiffness [11, 12]. Research presented in an article by F. Viola in 2018 demonstrates new capabilities of the device for studying fibrinolytic activity.
Fully automated 4-channel hemostasis analyzer TEG 6s (Haemonetics, USA). The system is a portable system that uses a multi-channel cartridge and is resistant to external vibrations (Fig. 13).

A 400 µL blood sample is pipetted into the measuring cartridge and distributed among four separate channels of the cartridge, each containing various reagents and coagulation activators. Approximately 20 µL of sample is drawn into each measuring channel, and excess blood is removed. After measurement begins, a piezoelectric activator changes the meniscus position of the vertically positioned sample, which is detected by an optical sensor. The incoming signal has a maximum amplitude of 10 µR at a frequency of 20 to 500 Hz. A Fourier transform evaluates the oscillation frequency at which the sample has the maximum meniscus oscillation amplitude, corresponding to the coagulation process.
The device uses two cartridges. The first, the Global Heemostasis Cartridge, conducts tests on citrated blood and allows for the following parameters to be obtained:
Kaolin TEG is an assessment of the activation of the intrinsic coagulation pathway, which characterizes the risk of bleeding or thrombosis.
Kaolin TEG with Heparinase – assessment of activation of the intrinsic coagulation pathway in the presence of a heparin inhibitor, which allows the presence of heparin in the sample to be assessed.
RapidTEG™ – coagulation testing with both intrinsic and extrinsic pathway activation, providing faster coagulation assessment.
TEG Functional – assessment of activation of the extrinsic coagulation pathway in the presence of a platelet receptor GPIIb/IIIa inhibitor; the use of this test allows one to evaluate the contribution of platelets and fibrinogen to changes in clot density (Fig. 14).

The second Cartridge Platelet Mapping cartridge, which analyzes a heparinized blood sample, allows for platelet function mapping.
The cartridge contains ADP and arachidonic acid reagents, which generate thrombin and activate platelets. Platelet aggregation inhibition is assessed relative to the Kaolin TEG control assay value.
ROS PLATELET FUNCTION ANALYZERS
The PFA-100 Platelet Function Analyzer (Siemens, Deerfield, IL, USA) simulates the bleeding time test (Fig. 15). The device uses a special cartridge that measures the time it takes for a hole in a membrane containing adrenaline and/or ADP and collagen to close following platelet thrombus formation.

Figure 16 shows a diagram and electron microscopy of changes in the cartridge membrane during testing. No more than 800 µL of citrated blood is required for testing. The testing speed is approximately six tests per hour. The device can be used to diagnose von Willebrand disease and to monitor aspirin and clopidogrel intake.

of changes in the cartridge membrane during the study
The VerifyNow system (Instrumentation Lab./USA) (Fig. 17). This device is a POC system based on the assessment of the optical density of a mixture of the test blood sample and latex particles coated with fibrinogen in special cartridges containing specific platelet aggregation inducers (ADP, thrombin-activating peptide; platelet receptors; arachidonic acid). Thus, the system is equipped with three types of cartridges, allowing monitoring of changes in platelet aggregation during therapy with acetylsalicylic acid (aspirin), thienopyridine derivatives (clopidogrel, Plavix), and platelet receptor IIB/IIIA inhibitors (Reopro) (Fig. 18).
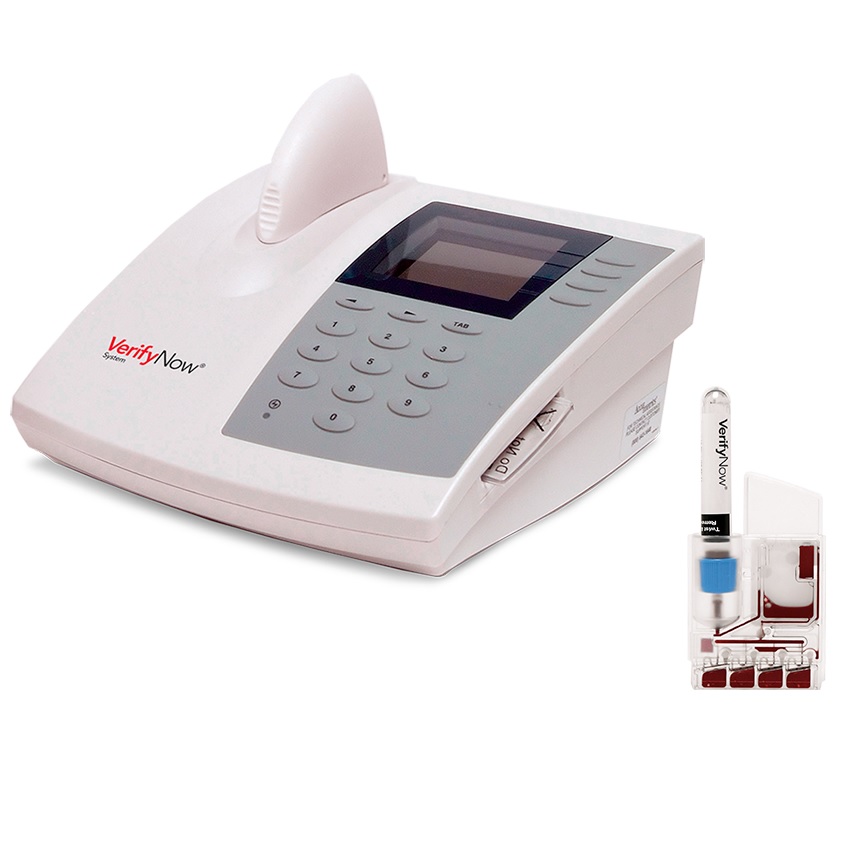
The test requires 2 ml of citrated blood. The test takes 2 to 5 minutes, depending on the cartridge type, and provides a result as a percentage of residual platelet aggregation activity. This system currently ranks among the leading ROS platelet function analyzers and is considered the #1 device of its kind in the United States.
A. B. Kosyrev,
Associate Professor, Department of Biochemistry, Russian Medical Academy of Postgraduate Education, Moscow
Literature:
1. MH Qari, Combi. Chem. High Throughput Screen. 8 (2005) 353.
2. G. Lippi, E. J. Favalaro, M. Franchini, G. C. Guidi, Semin. Thromb. Haemost. 35 (2009) 9.
3. A. J. Quick, M. Stanleybrown, F. W. Bancroft, Am. J. Med. Sci., 190 (1935) 501.
4. M. Heins, H. Reinauer, J. Int. Fed. Clin. Chem. 8 (1996) 117.
5. B. F. Rodak, G. A. Fritsma, K. Doig, Hematology: Clinical Principles and Applications, third ed., Elsevier Saunders, Missouri, 2007.
6. C. E. Dempfle, M. Borggrefe, Semin. Thromb. Hemost. 34 (2008) 445.
7. C. F. Weber, K. Zacharowski, Dtsch. Arztebl. Int. 109 (2012) 369.
8. Kaufman CR, Dwyer KN, Cruz JD, Dols SJ, Trask AL. Usefulness of thromboelastography in assessment of trauma patient coagulation. J Trauma 1997; 42: 716–20.
9. Kestin AS, Valeri CR, Khuri SF, et al. The platelet function defect of cardiopulmonary bypass. Blood 1993; 82:107–17.
10. Koster A., Kukucka M., Fischer T., Hetzer R., Kuppe H. Evaluation of post-cardiopulmonary bypass coagulation disorders by differential diagnosis with a multichannel modified thromboelastogram: a pilot investigation. J Extra Corp Technol 2001; 33: 153-8.
11. Lang T., Johanning K., Metzler H., Piepenbrock S., Solomon C., Rahe-Meyer N., Tanaka KA The effects of fibrinogen levels on thromboelastometric variables in the presence of thrombocytopenia. Anesth Analg. 2009; 108:751-8. [PubMed: 19224779].
12. Solomon C., Ranucci M., Hochleitner G., Schochl H., Schlimp C.J. Assessing the Methodology for Calculating Platelet Contribution to Clot Strength (Platelet Component) in Thromboelastometry and Thrombelastography. Anesth Analg. 2015; 121: 868-78. [PubMed: 26378699].
Kosyrev A.B., OOO TPO Medio Lab / Modern laboratory diagnostics // Industry reference books, No. 2 (28) ’19.